Characteristics of U.S. Goat Meat Consumers
Characteristics of U.S. Goat Meat Consumers
Fact Sheet — Lincoln University Cooperative Extension
Author: Ye Su Associate Professor - Lincoln University of Missouri
103B Lorenzo Green Hall, 900 to 906 Leslie, Jefferson City, MO 65101 • Office: (573) 681-5370
Reviewers: Jennifer Lute
Publication Code: AB-FS-1(8-2025)
This fact sheet is intended to provide readers with information on Goat meat consumers. It should not be considered the whole information for your consumption and production needs for Goat meat. The mention of the name of a product does not mean the author endorses the use of the product over others not mentioned. Anyone using this information should consult the label before using it. The label provides all the legal information. Using the products will mean you accept all the risks associated with the products.
The small ruminant industry has grown rapidly in the United States and Missouri during the past few decades, driven primarily by the increase of small acreage producers. In 2024, Missouri had the second largest inventory of all meat goat producing states in the U.S.
This fact sheet provides information on the characteristics of U.S. goat consumers based on a recent consumer survey conducted online from February to July 2024. In total, 1,784 valid responses were received from across the U.S. The respondents were meat eaters and were at least 18 years old. Among them, 1,033 purchased goat meat in the past year.
As shown in Table 1, survey respondents’ demographics indicate that the average age of goat consumers is 33 years. About 65% of them are male, 22% have parents or grandparents born in foreign countries, 90% are Caucasians (including people from Europe, the Middle East, and North Africa), and 94% have a household income of less than $100,000 per year. Additionally, 92% have a bachelor’s or higher degree. The demographics of goat consumers are comparable to the sample.
| Sample | Goat (N=1033) | |
| Age | 33 | 33 |
|
Gender Male Female |
65% 35% |
65.3% 34.6% |
|
Education Bachelor or Above |
92% |
93.4% |
|
Immigration Background Yes No |
23% 75% |
21.7% 76.3% |
|
Ethnicity Caucasian Native American Latino or Hispanic African American Asian Other |
88.4% 4.0% 2.7% 2.4% 2.2% 0.3% |
89.5% 4.2% 2.5% 1.8% 1.7% 0.4% |
| Household Income | ||
|
Less than $10,000 $10,000 to $19,999 $20,000 to $29,999 $30,000 to $39,999 $40,000 to $49,999 $50,000 to $59,999 $60,000 to $69,999 $70,000 to $79,999 $80,000 to $89,999 $90,000 to $99,999 $100,000 to $149,999 $150,000 or more |
0.96% 2.36% 4.83% 6.63% 12.82% 30.80% 10.29% 10.62% 6.91% 6.41% 5.96% 1.41% |
0.77% 1.74% 3.19% 7.26% 14.33% 31.56% 10.16% 12.58% 6.39% 6.10% 4.45% 1.45% |
About 45% of respondents said they purchased goat meat in the past year. Among those who purchased goat meat, 66% did so at least once a week, and 33% did so once a month (Figure 1). Meat stores and farmers’ markets are the two most popular places to purchase goat meat (Figure 2). Other avenues for purchase include butchers, grocery stores, restaurants, and direct from farmers. More than 70% of consumers purchase goat meat for various holidays, with Christmas and Easter being the top two on the list (Figure 3). It is not surprising that Thanksgiving is number four on the list as most of the respondents are ‘typical’ U.S. citizens, and Thanksgiving is one of the most celebrated holidays with gatherings of families and friends.
Figure 1. Percentage of Goat Meat Purchase Frequencies
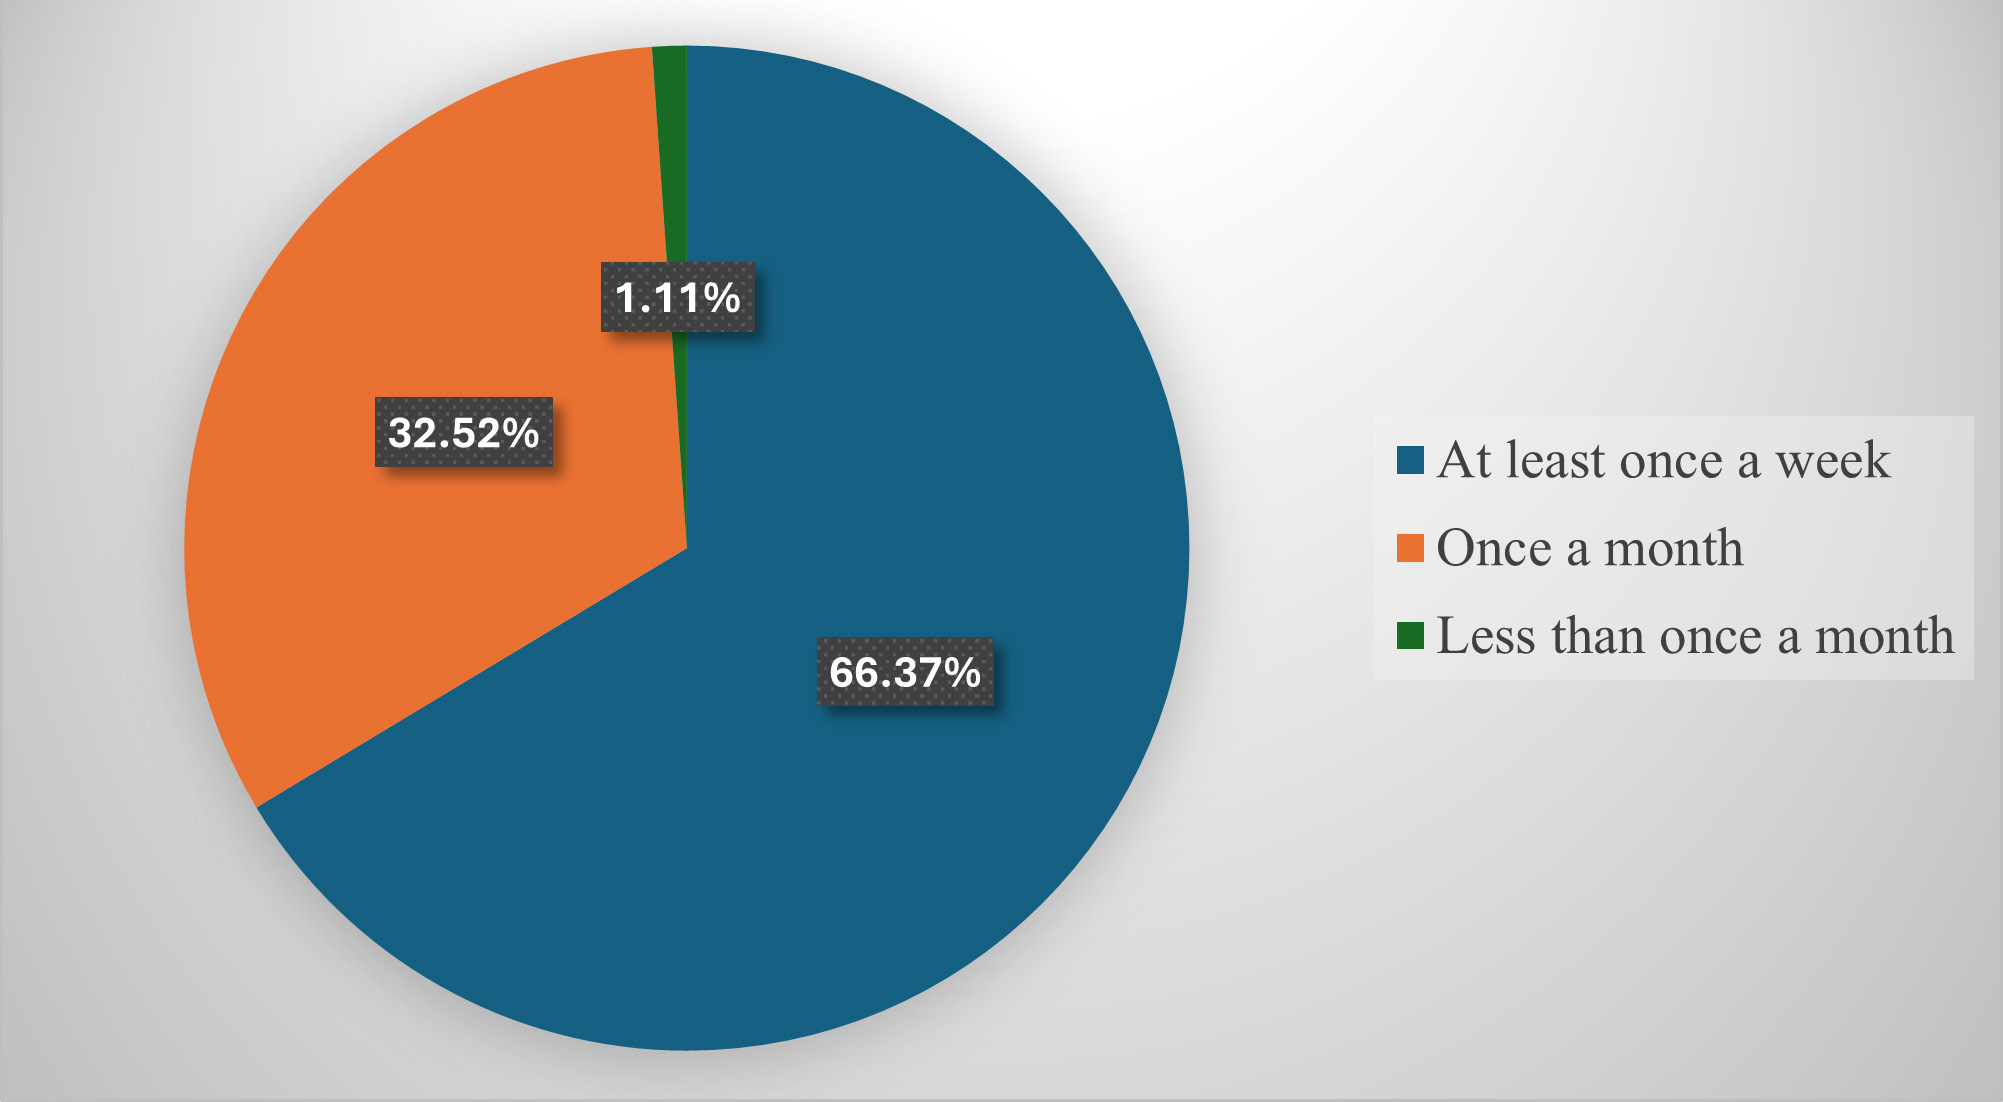
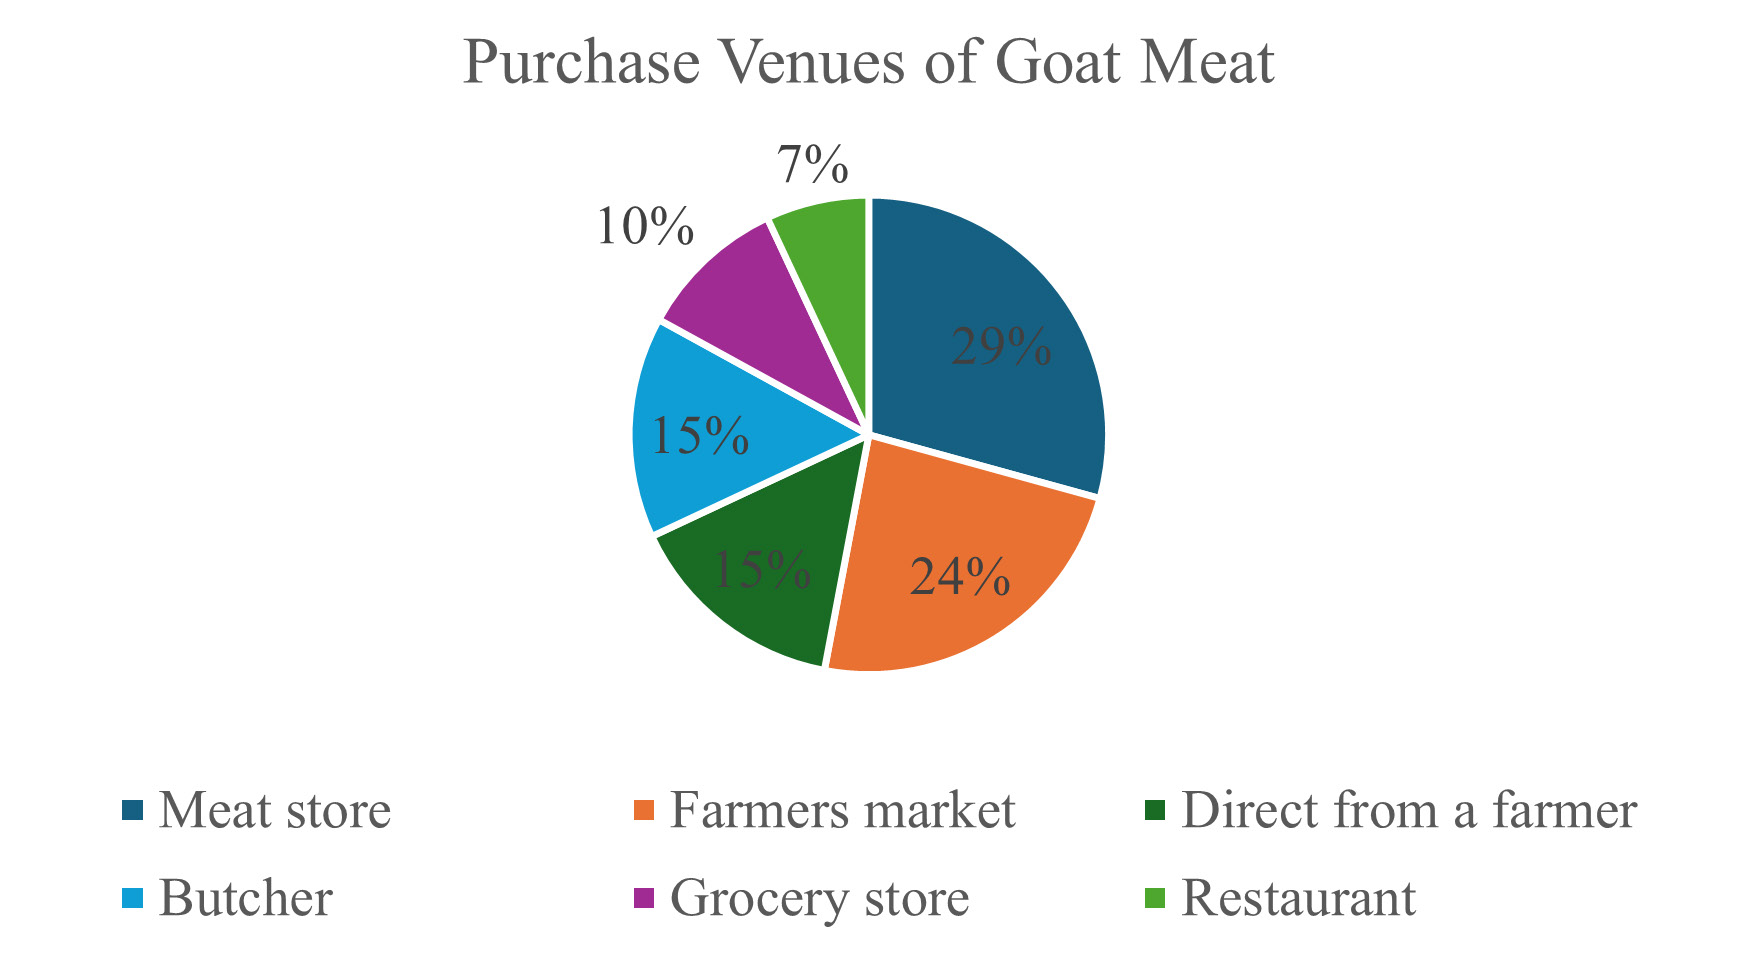
Figure 2. Percentage of goat meat shopping locations
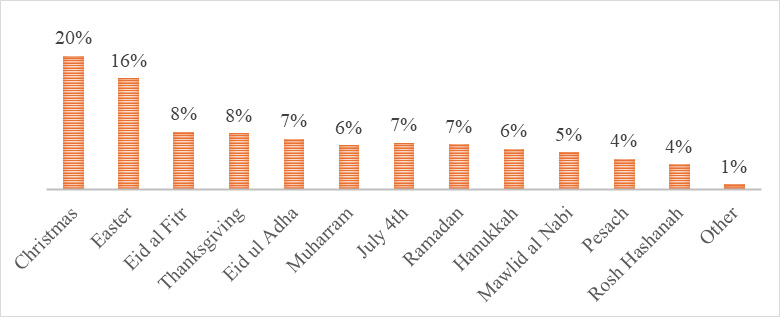
Figure 3. Percentage of purchases on different holidays
Consumers consider many factors when purchasing goat meat (Table 2). Among the 25 factors we asked for in the survey, taste is the most important, with an average of 4.05 out of 5. Weight, quality, safety, and protein content are next on the list. Surprisingly, price is number 8 on the list, followed by Halal. Animal welfare was ranked least important on the list.
Table 2. Factors Affecting Consumers’ Purchase of Goat Meat
| Factors | Mean | SD | Factors | Mean | SD | Factors | Mean | SD | ||
| Taste | 4.05 | 0.83 | Store cleanliness |
3.81 | 0.85 | Origin | 3.77 | 0.88 | ||
| Quantity (weight) |
3.94 | 0.87 | Condition (fresh or frozen) |
3.8 | 0.82 | Carbon footprint | 3.76 | 0.86 | ||
| Quality | 3.92 | 0.87 | Convenience | 3.8 | 0.88 | Biodegradable packaging |
3.75 | 0.80 | ||
| Safety | 3.91 | 0.87 | Seller reputation |
3.8 | 0.89 | Free from antibiotics and hormones |
3.73 | 0.88 | ||
| Protein content |
3.88 | 0.87 | Cholesterol content |
3.79 | 0.89 | Organic/ecological production |
3.7 | 0.94 | ||
| Package | 3.87 | 0.83 | Availability | 3.78 | 0.86 | Fat content | 3.69 | 0.88 | ||
| Grass-fed | 3.85 | 0.88 | Bone-in or boneless |
3.78 | 0.88 | Kosher | 3.61 | 0.86 | ||
| Price | 3.83 | 0.82 | Free from pathogens and diseases |
3.77 | 0.87 | Animal welfare | 3.60 | 0.90 | ||
| Halal | 3.81 | 0.87 |
Note: Consumers were asked to rank the importance of each factor from 1 to 5,with 1 as the least important, and 5 as the most important.
Summary
Unlike many previous studies, which showed that the typical consumers of goat meat are ethnic groups with immigrant backgrounds, our study found that more Americans than expected regularly eat goat meat. In fact, goat meat is the second most purchased meat after chicken. Meat stores and farmers’ markets are popular places for consumers to purchase goat meat. The majority of the respondents purchase goat meat on holidays, with Christmas, Easter, Eid al Fitr, and Thanksgiving at the top of the list. Out of 25 factors important to consumers’ goat meat purchases, taste, quantity, quality, and safety are the top four.
This information can be used by goat producers interested in direct consumer sales. For example, they can market their good taste, safe handling, high quality, and convenient packaging in a one-meal portion at farmers’ markets. By doing so, they may also charge a premium, since the study revealed consumers are not as sensitive to price.