
Missouri Small Ruminant Production Survey Report
Missouri Small Ruminant Production Survey Report
Lincoln University and The University of Missouri Extension
October 2025
Table of Contents
- Executive Summary
- Introduction
- Survey Methodology
- Sheep Producer Survey Results
- Goat Producer Survey Results
- Survey Summary
The following authors contributed to this report:
Alan Spell, Assistant Extension Professor - University of Missouri Extension;
Jennifer Lutes, Associate Extension Professional - University of Missouri Extension;
Ye Su, Associate Professor, Cooperative Research and Extension - Lincoln University of Missouri;
Homero Salinas-Gonzalez, Associate Professor, Cooperative Research and Extension - Lincoln University of Missouri
This report is part of the Assessing Opportunities and Challenges of the Small Ruminant Industry project funded by a grant from the USDA National Institute of Food and Agriculture, Award Number: 2023-67024-39220
Executive Summary
Lincoln University and the University of Missouri Extension conducted the Small Ruminants Production Survey, ending in June 2025, to gain deeper insight into the operations and sales of Missouri's sheep and goat producers. Supported by USDA National Institute of Food and Agriculture funding, this survey aims to help strengthen the state's small ruminant industry by guiding the development of Extension resources.
A total of 64 producers responded to the survey: 39 goat producers, 18 sheep producers, and seven who raised both. Due to the limited number of responses, the reported figures should not be considered representative of all small ruminant producers, even though they provide useful insights and support for understanding general trends.
Sheep Producer Findings
- Most sheep producers were older (half aged 55+) and predominantly male (69%). More than half had been raising sheep for a decade or longer (53%). Three out of four raised sheep for supplemental income.
- The typical flock was small with a median of 30 ewes, two rams, and 39 lambs. This is also confirmed by 2022 U.S. Agriculture Census data, showing that 90% of sheep farms have less than 100 animals. Katahdin and Katahdin crossbred sheep were the most common breeds.
- Sheep were primarily raised for meat (88%) and breeding stock (64%).
- Marketing relied heavily on word-of-mouth (83%) and social media (58%).
- Reported production costs included a median of $20,600 in annual mortgage payments, $2,500 for hay, and $1,831 for concentrated feed and supplements.
- The median business owner worked 461 hours annually in sheep production.
- Producers noted strong interest in resources about breeding, herd health, animal nutrition, and pasture management.
Goat Producer Findings
- Goat producers were generally younger and more likely to be female than sheep producers: over half were aged 35–54, and 60% were female. Most producers started operations in the past five years (55%).
- Like sheep producers, most operators raised goats for supplemental income (60%). This is comparable to state data, where 57% of the farms reported sales in 2022.
- The typical herd was small with a median of 15 does, three bucks, and 17 kids. Boer (41%) and Nubian (36%) were the most common goat breeds.
- Goats were mainly raised for meat (67%) and breeding stock (61%); one-third also raised goats for milk. This is comparable to the 2022 U.S. Agriculture Census, indicating that 75% of Missouri goat producers raised goats for meat while 31% raised them for milk.
- Marketing similarly focused on word-of-mouth and social media (both 69%).
- Reported production costs included a median of $1,750 for insurance, $1,500 for concentrated feed and supplements, and $1,200 for hay.
- The median business owner worked 730 hours annually in goat production.
- Producers showed strong interest in resources about breeding, herd health, animal nutrition, and parasite control.
The survey highlights the diversity and mostly small-scale nature of Missouri's sheep and goat operations. Findings suggest targeted educational materials focusing on breeding, health, nutrition, and pasture or parasite management would provide the greatest value. While marketing is mainly informal, there may be opportunities for Extension to help producers diversify marketing channels and manage costs effectively.
Missouri Small Ruminant Production Survey Report
Introduction
The U.S. sheep industry has a long history, once supported by a strong demand for wool, but is now more focused on producing meat. The national sheep inventory has declined sharply from over 50 million heads in the early 1900s to just over 5 million in 2024, reflecting a long-term downward trend. Sheep population locations across the country have changed in recent years due to the introduction of hair breeds. Wool breeds dominate western U.S. sheep populations, while hair breeds are more common in non-western states.
The U.S. goat industry is a relatively young industry, with the first state inventory numbers published by the U.S. Agriculture Census in 1997. With little historical data and growing consumer demand, this is an industry we need to understand more about. Since 2000, multiple meat breeds have been introduced and found popularity in the U.S. The industry is growing infrastructure and finding shelving space at local grocers; however, it is not an entrenched meat in U.S. consumer diets like beef, pork, and chicken. It is still a niche meat that many consumers are not familiar with. Globally, goat meat is far more significant, with China producing 2.5 million metric tons in 2022, more than the next four countries combined. Despite this, Australia leads world exports, shipping 21.3 thousand tons of goat meat in 2022. The United States remains a net importer of meat from sheep and goats, importing more than double domestic production in 2024. Therefore, increasing the competitiveness of domestic producers can help meet domestic demand and reduce imports.
Small ruminant producers (namely sheep and goat) are a growing part of Missouri's livestock sector. From 2015 to 2024, the state's sheep and lamb inventory grew by 25.9%, increasing from 85,000 to 107,000 head, elevating Missouri's national ranking from 17th to 14th.
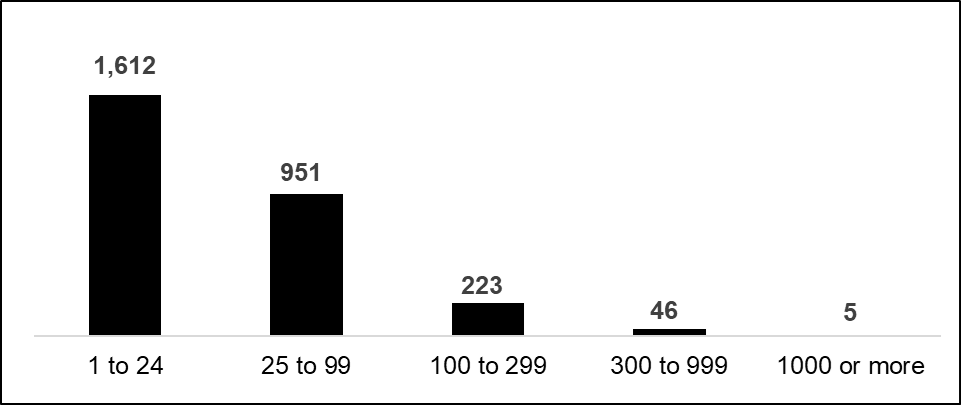
The 2022 U.S. Agriculture Census shows there were 2,837 sheep farms in Missouri. More than 90% of those had fewer than 100 animals, and among these, 57% had fewer than 24 sheep or lambs —see Exhibit 1. From 2017 to 2022, the number of sheep farms decreased, but the total inventory increased by 8% from 111,621 to 120,895. The average sheep or lambs per farm increased from 36 to 43. Among them, 2,077 farms (73%) sold lamb or sheep, with a total of $15.51 million in sales. About 580 farms produced 284,110 pounds of wool and sold it for $65,000.
Exhibit 1. Missouri Sheep Operations in 2022, by Number of Sheep
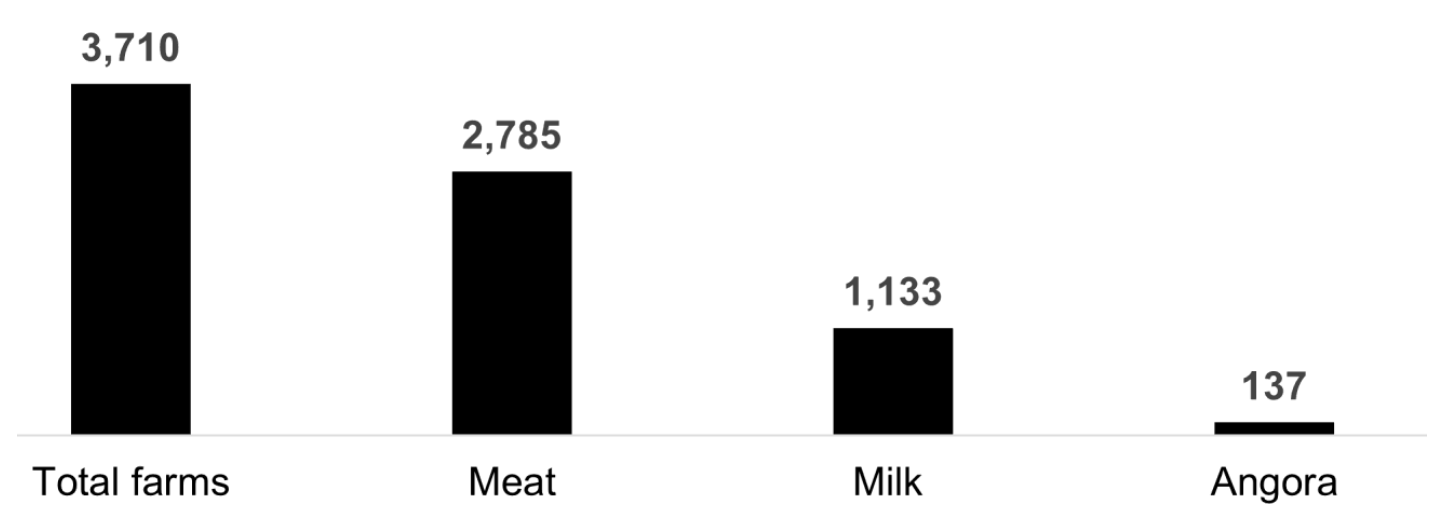
Missouri's goat inventory declined from 2015 to 2024 by 4.73% (from 91,000 to 86,700 head), yet the state improved its national ranking to 4th for all goats and 2nd for meat and other goats. In 2022, Missouri had 3,710 goat farms, which produced 74,139 goats. As shown in Exhibit 2, over 75% of these farms produced meat goats, 31% produced milk goats, and 3.6% produced Angora goats. Among these farms, 2,120 farms sold 38,262 goats, with a value of $8.16 million in sales. About 78% of these farms had less than $50,000 in farm sales.
Exhibit 2. Missouri Goat Operations in 2022, by Product
Understanding Missouri's small ruminant producers' needs will help increase productivity, profitability, and competitiveness, helping to meet growing domestic consumer demand. To gain deeper insights into this industry, Lincoln University and the University of Missouri Extension conducted a statewide survey to better understand operations and sales activities. Funded by a USDA National Institute of Food and Agriculture grant, the project supports producers in making informed production and marketing decisions to strengthen Missouri's small ruminant industry.
Survey Methodology
An anonymous online survey was used to gather data on sheep and goat operations. The survey questions are provided at the end of this report. To help producers prepare to share specific operational details, Lincoln University's Small Ruminant Program website housed survey background information as well as a companion Excel worksheet and PDF to compile operational information. Survey outreach included social media promotion, email campaigns, and in-person promotion at Extension field days and workshop events.
From September 2024 to June 2025, a total of 64 producers responded: 39 goat producers, 18 sheep producers, and seven who raised both. To understand operational differences, survey results are presented separately for sheep and goat producers; responses from mixed operations are included in both groups.
Because of the limited number of survey responses, the reported figures should not be considered representative of all small ruminant producers.
Sheep Producer Survey Results
Twenty-five sheep producers participated in the survey, responding to some or all the questions about their operations. Their responses are summarized below by category: producer background, operational characteristics, sales and marketing, and production costs. The number of responses for each question is noted in italics below the tables (e.g., n = 16).
Producer Background
Of the 19 producers who shared location information, 89% reported their primary operation was in Missouri, with most located in the Central Region. As shown in Exhibits 3 and 4, half of the sheep producers were aged 55 or older, compared to less than a quarter of goat producers, and two-thirds were male.
Exhibit 3. Sheep Producers by Age
| Age | Count | Percent |
|---|---|---|
| 18-24 | 1 | 6% |
| 25-34 | 3 | 19% |
| 35-54 | 4 | 25% |
| 55-64 | 5 | 31% |
| 65+ | 3 | 19% |
| Total | 16 | 100% |
n=16
Exhibit 4. Sheep Producers by Gender
| Gender | Count | Percent |
|---|---|---|
| Male | 11 | 69% |
| Female | 5 | 31% |
| Total | 16 | 100% |
n=16
Eighty-eight percent of sheep producers identified as White, and more than two-thirds held a bachelor's degree or higher (69%), as seen in Exhibits 5 and 6. Outlined in Exhibit 7, 32% of producers started raising sheep in 2020 or later, while more than half had been raising sheep for a decade or longer (53%).
Exhibit 5. Sheep Producers by Race
| Race | Count | Percent |
|---|---|---|
| White | 14 | 88% |
| Black or African American | 0 | 0% |
| American Indian or Alaska Native | 0 | 0% |
| Asian-American or Asian | 0 | 0% |
| Native Hawaiian or Other Pacific Islander | 0 | 0% |
| Other | 1 | 6% |
| Prefer Not to Answer | 1 | 6% |
| Total | 16 | 100% |
n=16
Exhibit 6. Sheep Producers by Educational Attainment
| Educational Attainment | Count | Percent |
|---|---|---|
| Less Than a High School Degree | 1 | 6% |
| Some College But No Degree | 2 | 13% |
| Associate's/Tech. Degree or Apprenticeship | 1 | 6% |
| Bachelor's Degree or Higher | 11 | 69% |
| Prefer Not to Answer | 1 | 6% |
| Total | 16 | 100% |
n=16
Exhibit 7. Year Started Raising Sheep
| Year | Count | Percent |
|---|---|---|
| 2009 or Earlier | 5 | 26% |
| 2010 to 2014 | 5 | 26% |
| 2015 to 2019 | 3 | 16% |
| 2020 or Later | 6 | 32% |
| Total | 19 | 100% |
n=19
Among sheep producers, 75% of operators raised sheep for supplemental income (see Exhibit 8). Most households relied primarily on off-farm income, followed by retirement income. Only one producer reported sheep production as their primary source of household income.
Exhibit 8. Sheep Production's Contribution to Household Income
| Response | Count | Percent |
|---|---|---|
| Supplemental Income to Other Primary Job Off the Farm | 6 | 38% |
| Supplemental Income to Retirement Funds | 4 | 25% |
| Supplemental Income to Larger Farm/Livestock Operations | 2 | 13% |
| Primary Household Income (over 50% of total income) | 1 | 6% |
| Other Sources of Income | 1 | 6% |
| No Income (do not sell products or livestock) | 2 | 13% |
| Total | 16 | 100% |
n=16
To inform Extension resource development, producers were asked which topics interested them most. Breeding, herd health, and animal nutrition topped the list, each cited by 69% of producers and indicated in Exhibit 9. Pasture management followed at 63%, while marketing and parasite control were also mentioned by more than half of sheep producers.
Exhibit 9. Topics of Interest for Extension Guides
| Topics | Count | Percent |
|---|---|---|
| Breeding | 11 | 69% |
| Herd Health | 11 | 69% |
| Animal Nutrition | 11 | 69% |
| Pasture Management | 10 | 63% |
| Marketing | 9 | 56% |
| Parasite Control | 8 | 50% |
| Pricing and Sales | 7 | 44% |
| Value-added Products | 3 | 19% |
| Other | 1 | 6% |
| None | 1 | 6% |
n=16
Operation Characteristics
Producers were asked about their flock size, preferred breeds, and other livestock they managed. As shown in Exhibit 10, nineteen producers reported flock sizes ranging from fewer than five to nearly 1,000 sheep. The median producer had 30 ewes, two rams, and 39 lambs born in the past year. Of those lambs, 66% were sold, 21% died, and 13% were retained.
Exhibit 10. Flock Size Statistics
| Measurement | Breeding Ewes | Ram | Lambs born and kept | Lambs born and sold | Lambs born and died | Total |
|---|---|---|---|---|---|---|
| Mean | 64.5 | 3.1 | 25.1 | 62.8 | 21.6 | 149.3 |
| Standard Error | 19.2 | 0.6 | 9.8 | 26.2 | 8.1 | 49.8 |
| Median | 30.0 | 2.0 | 5.0 | 26.0 | 9.0 | 63.0 |
| Mode | 20.0 | 2.0 | 20.0 | 2.0 | 1.0 | |
| Range | 348.0 | 7.0 | 149.0 | 480.0 | 99.0 | 916.0 |
| Minimum | 2.0 | 1.0 | 1.0 | 0.0 | 1.0 | 2.0 |
| Maximum | 350.0 | 8.0 | 150.0 | 480.0 | 100.0 | 918.0 |
| Count | 19 | 17 | 17 | 18 | 14 | 19 |
Over half of producers raised Katahdin or Katahdin crossbred sheep (53%), followed by 26% with Dorper crossbreds. Sixteen percent of producers reported managing Rambouillet, St. Croix, or related crossbreeds.
Twenty-four producers provided acreage data for sheep production. Most producers had fewer than 50 pasture acres (71%), while 8% operated on more than 100 acres, as seen in Exhibit 11. The median pasture size was 30 acres.
Exhibit 11. Pasture Acres Used for Sheep Production
| Topics | Count | Percent |
|---|---|---|
| Less than 10 Acres | 5 | 21% |
| 10 to 20 Acres | 3 | 13% |
| 20 to 30 Acres | 2 | 8% |
| 30 to 50 Acres | 7 | 29% |
| 50 to 100 Acres | 5 | 21% |
| More than 100 Acres | 2 | 8% |
| Total | 24 | 100% |
n=24
Most producers also managed other livestock on their farm (71%). Cattle were the most common, raised by 48% of producers, followed by poultry (33%) and goats (28%).
As shown in Exhibit 12, 88% of producers raised sheep primarily for meat production. A large share also raised sheep for breeding stock (64%). Fewer than 20% raised sheep mainly for milk or weed control.
Exhibit 12. Main Purposes for Raising Sheep
| Topics | Count | Percent |
|---|---|---|
| Meat | 22 | 88% |
| Breeding Stock | 16 | 64% |
| Milk | 4 | 16% |
| Weed Control | 4 | 16% |
| Fiber | 2 | 8% |
| Pets | 1 | 4% |
| Other | 3 | 12% |
n=25
Sales and Marketing
Producers were asked about when and where they sold sheep or sheep products, revenues from those sales, and how customers found their business. Most producers sold live sheep or lambs in the past year (90%), while 35% sold sheep or lamb products such as meat or milk (see Exhibit 13). March and October were the most common months for live animal sales, reported by 41% and 35% of producers, respectively. For product sales, November was the top month, with 83% of those selling products reporting revenue then, followed by March (67%).
Exhibit 13. Sold Sheep Items in the Last 12 Months
| Response | Count | Percent |
|---|---|---|
| Live Sheep or Lambs | 18 | 90% |
| Sheep or Lamb Products (meat, fiber, milk, etc.) | 7 | 35% |
| No Sales | 1 | 5% |
n=20
Only a small number of producers (six or fewer, depending on buyer type and product) reported sales figures. The average price per sheep or lamb was $197, though this figure varied widely ($40–$500 per head) and reflects limited data. Reported total sales ranged from $50 to more than $10,000, but with only five producers providing data, average sales figures were not calculated.
As shown in Exhibit 14, most producers relied on word-of-mouth (83%) and social media (58%) to connect with customers. Only one reported selling at a farmers' market.
Exhibit 14. How Do Customers Learn About Your Business?
| Response | Count | Percent |
|---|---|---|
| Word-of-Mouth | 10 | 83% |
| Social Media | 7 | 58% |
| Website | 2 | 17% |
| Farmers Market | 1 | 8% |
| Farm Stand | 1 | 8% |
| Other | 4 | 33% |
n=12
Production Cost
Producers were asked to report on their variable and fixed business expenses for the past 12 months. Variable expenses, like feed, change with production, while fixed expenses, like insurance, remain relatively stable.
About two-thirds of producers purchased sheep or lambs to expand their flock (65%). Six producers reported sheep purchases, with a median cost of $412 per animal. Five reported lamb purchases, with a median cost of $150.
A small number of producers provided variable expense data outlined in Exhibit 15; median costs are shown for expenses with at least five responses. Hay and concentrated feed/supplements had the highest median costs, followed by transportation.
Exhibit 15. Median Annual Cost of Other Variable Expenses
| Description | Median Cost |
|---|---|
| Hay | $2,500 |
| Concentrated Feed/Supplements | $1,831 |
| Transportation (fuel, etc.) | $1,250 |
| Guard Dogs | $1,044 |
| Vet Care and Medicines | $1,000 |
| Repair and Maintenance | $596 |
| Misc. Supplies (bedding, etc.) | $335 |
| Contract Services (shearing, etc.) | $300 |
| Weed or Insect Pasture Spray | $135 |
n=5 to 13
Several producers reported fixed expenses, with land mortgage payments showing the highest median cost. Exhibit 16 displays median fixed expenses for categories with at least five responses.
Exhibit 16. Median Annual Cost of Fixed Expenses
| Description | Median Cost |
|---|---|
| Land Mortgage Payments | $20,600 |
| Insurance | $2,200 |
| Property Taxes | $1,260 |
n=5 to 8
Only 31% of sheep producers hired labor, which aligns with the small size of most operations. Most labor needs were met by the business owner, with hours ranging from under 50 per year to full-time (2,000 hours). The median owner worked 461 hours annually.
Sheep producers in Missouri were generally older and predominantly male, with most raising sheep for supplemental income alongside off-farm or retirement earnings. Flocks were small, with a median of 30 ewes, two rams, and 39 lambs, typically managed on 30 acres or fewer. Katahdin and Katahdin crosses were the most common breeds, raised mainly for meat and breeding stock. Marketing was informal, relying on word-of-mouth (83%) and social media (58%), with most sales occurring in March and October. Reported costs were significant for small-scale operations, with median annual expenses of $2,500 for hay, $1,831 for feed, and $20,600 for land mortgages, while most labor was supplied by the owner, who spent a median of 461 hours per year on sheep production activities.
Goat Producer Survey Results
Forty-six goat producers participated in the survey, responding to some or all the questions about their operations. Their responses are summarized below by category: producer background, operational characteristics, sales and marketing, and production costs. The number of responses for each question is noted in italics below the tables (e.g., n = 30).
Producer Background
Of the 31 producers who shared location information, 74% reported their primary operation was in Missouri. Eight producers indicated other states, such as Oklahoma and Kansas, were home to their primary operations. As shown in Exhibits 17 and 18, more than half of goat producers were aged 35-54, generally younger than sheep producers, and more likely to be female (60%).
Exhibit 17. Goat Producers by Age
| Age | Count | Percent |
|---|---|---|
| 18-24 | 2 | 7% |
| 25-34 | 4 | 13% |
| 35-54 | 17 | 57% |
| 55-64 | 4 | 13% |
| 65+ | 3 | 10% |
| Total | 30 | 100% |
n=30
Exhibit 18. Goat Producers by Gender
| Gender | Count | Percent |
|---|---|---|
| Male | 12 | 40% |
| Female | 18 | 60% |
| Total | 30 | 100% |
n=30
Nearly all goat producers identified as White (97%), with one producer identifying as Black or African American (see Exhibit 19). Most producers had a bachelor's degree or higher (70%), as seen in Exhibit 20, aligning closely with education levels reported by sheep producers.
Exhibit 19. Goat Producers by Race
| Race | Count | Percent |
|---|---|---|
| White | 29 | 97% |
| Black or African American | 1 | 3% |
| American Indian or Alaska Native | 0 | 0% |
| Asian-American or Asian | 0 | 0% |
| Native Hawaiian or Other Pacific Islander | 0 | 0% |
| Other | 0 | 0% |
| Prefer not to answer | 0 | 0% |
| Total | 30 | 100% |
n=30
Exhibit 20. Goat Producers by Educational Attainment
| Educational Attainment | Count | Percent |
|---|---|---|
| Less Than High School Degree | 0 | 0% |
| Some College But No Degree | 1 | 3% |
| Associate's/Technical Degree or Apprenticeship | 7 | 23% |
| Bachelor's Degree or Above | 21 | 70% |
| Prefer Not to Answer | 1 | 3% |
| Total | 30 | 100% |
n=30
As shown in Exhibit 21, 55% of producers started raising goats in 2020 or later, compared to 32% of sheep producers. This aligns with goat producers generally being younger than their sheep producer counterparts.
Exhibit 21. Year Started Raising Goats
| Year | Count | Percent |
|---|---|---|
| 2009 or Earlier | 3 | 10% |
| 2010 to 2014 | 6 | 19% |
| 2015 to 2019 | 5 | 16% |
| 2020 or Later | 17 | 55% |
| Total | 31 | 100% |
n=31
Among goat producers, 60% of operators raised goats for supplemental income (see Exhibit 22), with most households relying on off-farm jobs. Only two producers said goat production was their primary income source, while 12% did not sell goats or related products.
Exhibit 22. Goat Production's Contribution to Household Income
| Response | Count | Percent |
|---|---|---|
| Supplemental Income to Other Primary Job Off the Farm | 11 | 44% |
| Other Sources of Income | 5 | 20% |
| Supplemental Income to Retirement Funds | 2 | 8% |
| Supplemental Income to Larger Farm/Livestock Operations | 2 | 8% |
| Primary Household Income (over 50% of total income) | 2 | 8% |
| No Income (do not sell products or livestock) | 3 | 12% |
| Total | 25 | 100% |
n=25
To inform Extension resource development, producers were asked which topics interested them most. Breeding and herd health topped the list, each cited by 63% of producers and indicated in Exhibit 23. Animal nutrition and parasite control were of interest to 60% of producers.
Exhibit 23. Topics of Interest for Extension Guides
| Topics | Count | Percent |
|---|---|---|
| Breeding | 19 | 63% |
| Herd Health | 19 | 63% |
| Animal Nutrition | 18 | 60% |
| Parasite Control | 18 | 60% |
| Pasture Management | 15 | 50% |
| Pricing and Sales | 14 | 47% |
| Marketing | 11 | 37% |
| Value-added Products | 7 | 23% |
| Other | 1 | 3% |
| None | 4 | 13% |
n=30
Operation Characteristics
Producers were asked about their herd size, preferred breeds and other livestock they managed. As shown in Exhibit 24, thirty-nine producers reported herd sizes ranging from fewer than five to more than 300 goats. The median producer had 15 does, three bucks, and 17 kids born in the past year. Of those kids, 59% were sold, while 26% were retained and 15% died.
Exhibit 24. Herd Size Statistics
| Measurement | Breeding Does | Bucks | Kids born and kept | Kids born and sold | Kids born and died | Total |
|---|---|---|---|---|---|---|
| Mean | 22.3 | 5.6 | 11.2 | 21.1 | 5.0 | 57.8 |
| Standard Error | 3.3 | 1.9 | 2.1 | 5.4 | 1.8 | 9.9 |
| Median | 15.0 | 3.0 | 4.5 | 10.0 | 2.5 | 37.0 |
| Mode | 50.0 | 1.0 | 4.0 | 5.0 | 0.0 | 22.0 |
| Range | 98.0 | 70.0 | 55.0 | 180.0 | 60.0 | 321.0 |
| Minimum | 2.0 | 0.0 | 0.0 | 0.0 | 0.0 | 4.0 |
| Maximum | 100.0 | 70.0 | 55.0 | 180.0 | 60.0 | 325.0 |
| Count | 39.0 | 36.0 | 38.0 | 36.0 | 34.0 | 39.0 |
Boer was the most common goat breed among producers (41%), followed by 36% with Nubians. Eighteen percent raised Myotonic goats, while 15% had Kiko or Nigerian Dwarf breeds.
Forty-five producers provided acreage data for goat production. Most producers had fewer than 20 pasture acres (76%), while 7% operated on more than 100 acres. The median pasture size was six acres, much smaller than the median for sheep producers.
Exhibit 25. Pasture Acres Used for Goat Production
| Response | Count | Percent |
|---|---|---|
| Less Than 10 Acres | 27 | 60% |
| 10 to 20 Acres | 7 | 16% |
| 20 to 30 Acres | 0 | 0% |
| 30 to 50 Acres | 4 | 9% |
| 50 to 100 Acres | 4 | 9% |
| More Than 100 Acres | 3 | 7% |
| Total | 45 | 100% |
n=45
Most producers also managed livestock other than goats on their farm (81%). Poultry were the most common, raised by 65% of producers, far more common than cattle (30%) and sheep (15%).
As seen in Exhibit 26, 67% of producers raised goats primarily for meat production. A large share also raised goats for breeding stock (61%), while a third of producers raised goats for milk (33%).
Exhibit 26. Main Purposes for Raising Goats
| Response | Count | Percent |
|---|---|---|
| Meat | 31 | 67% |
| Breeding Stock | 28 | 61% |
| Milk | 15 | 33% |
| Weed Control | 8 | 17% |
| Pets | 7 | 15% |
| Fiber | 1 | 2% |
| Other | 7 | 15% |
n=46
Sales and Marketing
Producers were asked about when and where they sold goat or goat products, revenues from those sales, and how customers found their business. Most producers sold live goats or kids in the past year (91%), while 28% sold goat or lamb products such as meat or milk (see Exhibit 27). Spring was a prime season for live goat or kid sales — producers reported sales in March (35%), April (41%), and May (32%). October was also an important month for sales, according to 30% of producers.
Spring was also critical for meat and milk product sales, with most producers selling in March (64%), April (82%), and May (73%). Over half of goat producers also sold products between June and September (55%).
Exhibit 27. Sold Goat Items in the Last 12 Months
| Response | Count | Percent |
|---|---|---|
| Live Goats or Kids | 39 | 91% |
| Goat or Kid Products (meat, fiber, milk, etc.) | 12 | 28% |
| No Sales | 4 | 9% |
n=43
Eighteen producers reported sales figures, with a median price of $180 per goat or kid. However, this number reflects a wide price range ($60-$1,000+ per head) and limited data. Only six producers reported meat or dairy sales, which ranged from under $25 to more than $5,000, so average figures were not calculated.
As shown in Exhibit 28, most producers relied on word-of-mouth or social media to reach customers, while one-fifth used a website (21%) and 17% sold at farmers' markets.
Exhibit 28. How Do Customers Learn About Your Business?
| Response | Count | Percent |
|---|---|---|
| Word-of-Mouth | 20 | 69% |
| Social Media | 20 | 69% |
| Website | 6 | 21% |
| Farmers Market | 5 | 17% |
| Farm Stand | 3 | 10% |
| Other | 3 | 10% |
n=46
Production Cost
Producers were asked to report their variable and fixed expenses from the past 12 months. Variable expenses, like feed, change with production, while fixed costs, like insurance, remain relatively stable.
Most producers purchased goats or kids to expand their herd (56%), with respondents reporting a median cost of $450 per goat and $350 per kid. A small number of producers provided other variable expense data, as outlined in Exhibit 29; median costs are shown for expenses with at least five responses. Hay and concentrated feed/supplements had the highest median costs, followed by guard dogs.
Exhibit 29. Median Annual Cost of Other Variable Expenses
| Description | Median Cost |
|---|---|
| Concentrated Feed/Supplements | $1,500 |
| Hay | $1,200 |
| Guard Dogs | $550 |
| Misc. Supplies (bedding, etc.) | $500 |
| Vet Care and Medicines | $450 |
| Transportation (fuel, etc.) | $400 |
| Contract Services (shearing, etc.) | $100 |
n=5 to 23
Only a small number of producers reported fixed expenses. Exhibit 30 displays median fixed expenses for categories with at least five responses.
Exhibit 30. Median Annual Cost of Fixed Expenses
| Description | Median Cost |
|---|---|
| Insurance | $1,750 |
| Property taxes | $1,100 |
n=8 to 9
Producers were also asked about their labor needs. Only 6% of producers hired labor, which aligns with the small size of many operations. Most labor needs were met by the business owner, with hours ranging from under 20 per year to nearly 1,500 hours. The median owner worked 730 hours annually. Seven producers reported total unpaid labor hours, which ranged from less than 25 hours to 3,000 hours. The median time worked by an unpaid laborer, likely a family member or friend, was 200 hours annually.
Goat producers in Missouri are generally younger, more likely to be female, and well educated, with most starting operations in the past five years. Herds are small, averaging about 15 does, three bucks, and 17 kids, typically managed on fewer than 20 acres. Operations focus on meat and breeding stock, with marketing relying on word-of-mouth and social media. Median sales were about $180 per head, while typical annual costs included $1,500 for feed, $1,200 for hay, and $1,750 for insurance, reflecting small-scale, supplemental-income enterprises supported mainly by family labor.
Survey Summary
Goat operations in Missouri tend to be smaller, newer, and run by younger, often female producers managing herds on fewer than 20 acres. These farms emphasize meat and breeding stock, with sales made mostly through informal networks. This survey, along with sheep and goat planning budgets, suggests that goat farmers typically have lower operating costs than sheep farmers.
Sheep operations, by contrast, are larger and more established, managed primarily by older male producers. They carry higher production costs and focus heavily on hair sheep raised for meat, with sales peaking seasonally in March and October. See Exhibit 31 for a comparison table of goat and sheep operations.
Goat and sheep farmers suggest that targeted educational materials focusing on breeding, health, nutrition, and pasture or parasite management would provide the greatest value.
Exhibit 31. Goat and Sheep Operations Comparison Table
| Category | Goat Operations | Sheep Operations |
|---|---|---|
| Farm Size & Scale | Very small herds: ~15 does, 3 bucks, 17 kids; often < 20 acres | Small flocks: ~30 ewes, 2 rams, 39 lambs; often < 50 acres |
| Producer Profile | Younger, more often female, many started farming in the past 5 years | Older, predominantly male, and often started farming over a decade ago |
| Breeds & Purpose | Primarily meat goats and breeding stock | Mostly hair sheep (Katahdin and crosses); raised for meat and breeding |
| Marketing | Informal: word-of-mouth, social media; small-scale sales | Informal as well, but more seasonal; sales peak in March & October |
| Economics | Example annual costs: ~$1,500 feed, ~$1,200 hay, ~$1,750 insurance | Example annual costs: ~$2,500 hay, ~$1,831 feed, ~$20,600 mortgage |
| Key Takeaways | Smaller, newer operations with lower costs and younger producers | Larger, more established operations with higher costs and older producers |